Fig. C.1
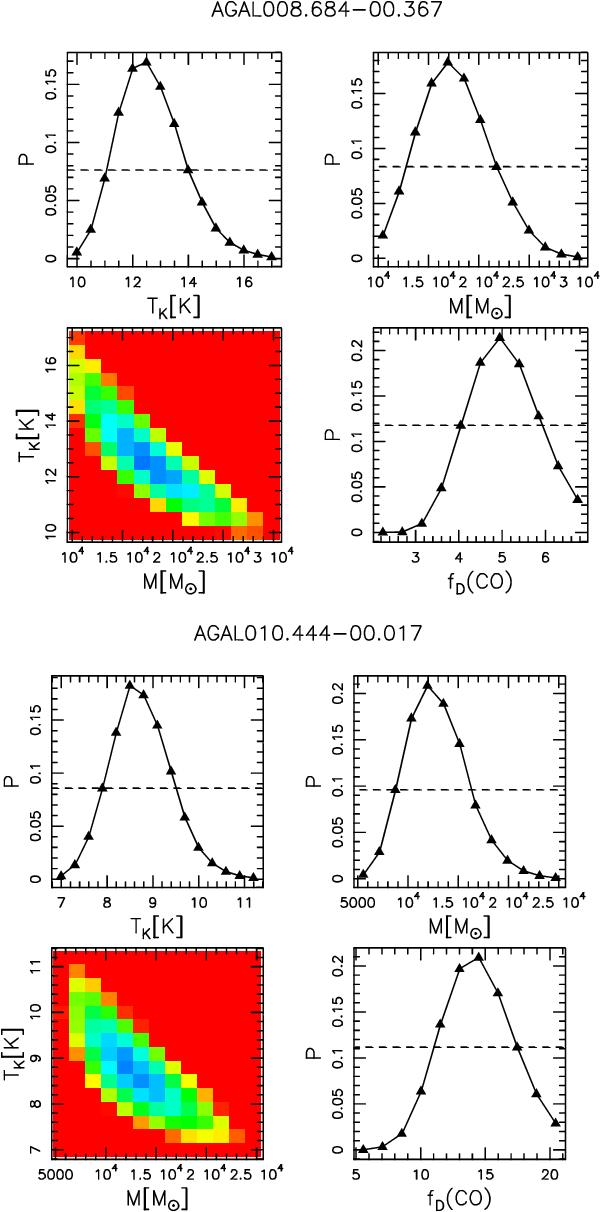
RATRAN results for individual sources, using models with a constant abundance profile. The panels show: (top left) marginal probability distribution of the temperature/luminosity, depending on the group of the source, (top right) marginal probability distribution of the mass, (bottom left) joint probability distribution of mass and T or L (depending on whether model is centrally heated or isothermal), (bottom right) marginal probability distribution of the depletion factor.
Current usage metrics show cumulative count of Article Views (full-text article views including HTML views, PDF and ePub downloads, according to the available data) and Abstracts Views on Vision4Press platform.
Data correspond to usage on the plateform after 2015. The current usage metrics is available 48-96 hours after online publication and is updated daily on week days.
Initial download of the metrics may take a while.