Fig. 3
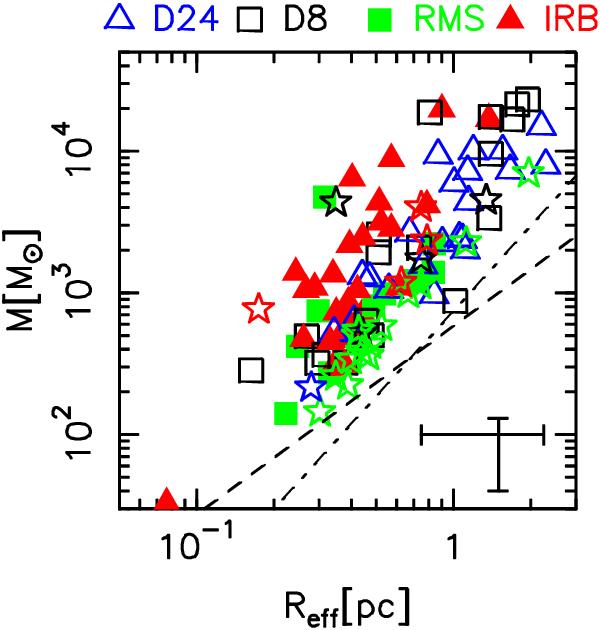
Mass-radius plot. Reff is calculated according to Rosolowsky et al. (2010), using the sizes from Csengeri et al. (2014), and it is approximately equal to the FWHM size of the clump. The Kauffmann & Pillai (2010) relation (dashed line) was rescaled to match our values of the dust opacity. The dash-dotted line indicates the threshold of Σ = 0.05 g cm-2 proposed by Urquhart et al. (2013a) for high-mass star formation to occur. All the sources are found above it, suggesting that they are potentially forming massive stars. A typical uncertainty for the mass (for subsamples S1 and S2) is shown in the bottom right corner. We also indicate the effect of a hypothetical uncertainty of 50% in Reff. Each group of sources is shown with a different symbol and colour, as indicated. The stars refer to sources of subsample S3, while their colour still identifies the group (red = IRB, green = RMS, black = D8, and blue = D24).
Current usage metrics show cumulative count of Article Views (full-text article views including HTML views, PDF and ePub downloads, according to the available data) and Abstracts Views on Vision4Press platform.
Data correspond to usage on the plateform after 2015. The current usage metrics is available 48-96 hours after online publication and is updated daily on week days.
Initial download of the metrics may take a while.