Fig. 2
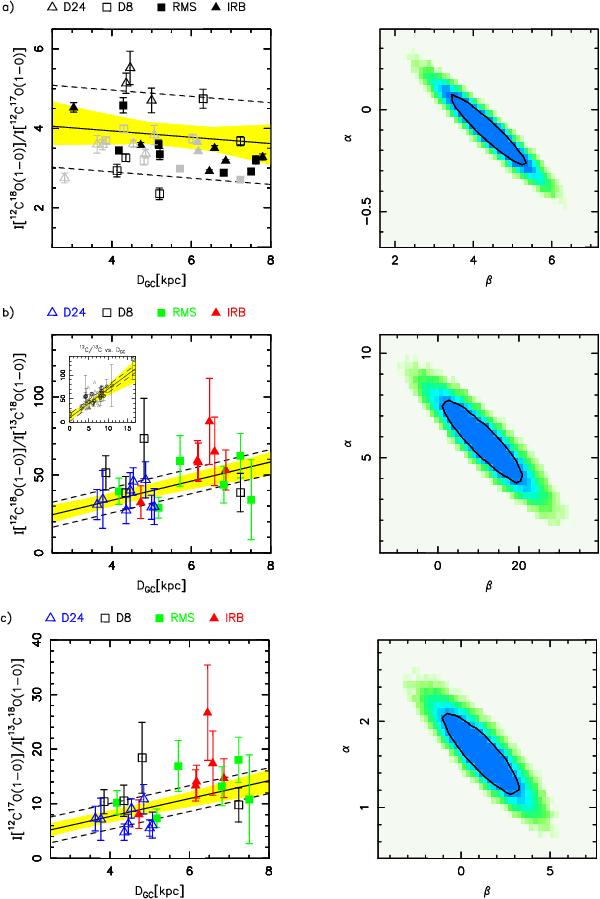
Ratio of integrated fluxes of different CO isotopologues as a function of Galactocentric radius. In the right panel of each row we show the joint probability distribution of the parameters of the fit (y = αx + β); in black we indicate the 68% contour. In the left panel of each row, the black solid line is the best fit, the yellow shaded area shows the 68% uncertainty, and the dashed lines show the intrinsic scatter of the relation. Panel a) shows the ratio I [12C18O(1 − 0)] /I [12C17O(1 − 0)] (see Eq. (1)), each group of sources is shown with a different symbol, as indicated above the left panel. Black points are those with an estimated  optical depth less than 0.3 (only from the detection equation), grey points are those with τ> 0.3. Panel b) shows the ratio I [12C18O(1 − 0)] /I [13C18O(1 − 0)]; each group of sources is shown with a different symbol and colour, as indicated. The small box in the top left corner shows the points from Milam et al. (2005) as black circles, and those from this work as grey triangles. Finally, panel c) is the same as b) for the ratio I [12C17O(1 − 0)] /I [13C18O(1 − 0)].
Current usage metrics show cumulative count of Article Views (full-text article views including HTML views, PDF and ePub downloads, according to the available data) and Abstracts Views on Vision4Press platform.
Data correspond to usage on the plateform after 2015. The current usage metrics is available 48-96 hours after online publication and is updated daily on week days.
Initial download of the metrics may take a while.