Fig. 17
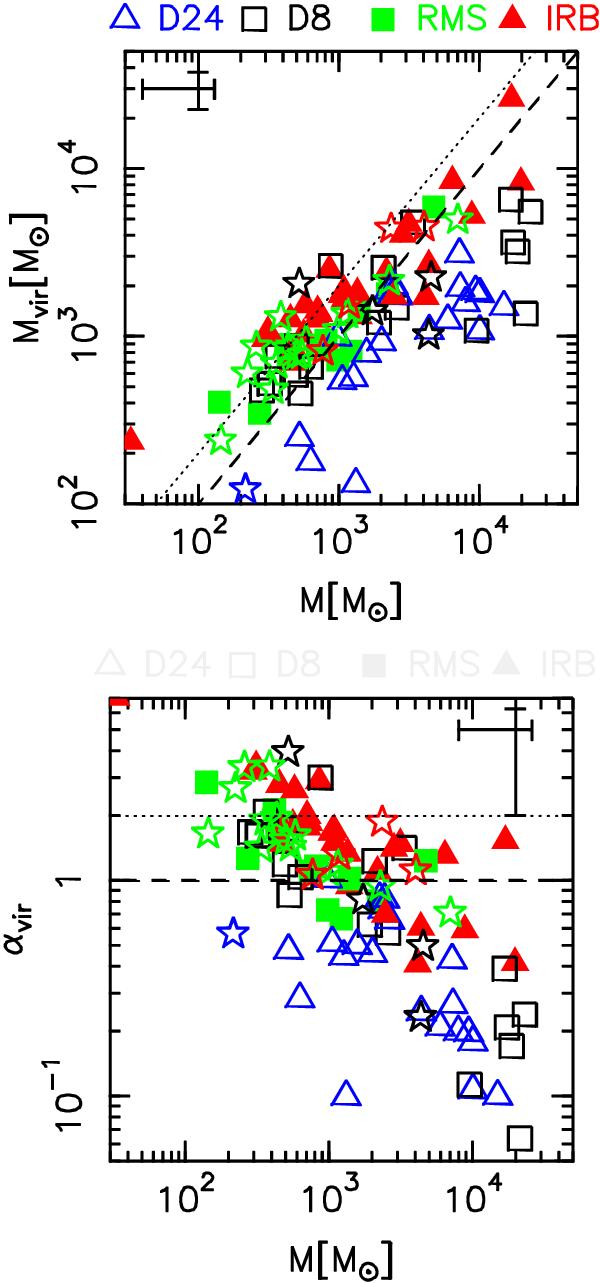
Comparison between the gas mass derived from ATLASGAL fluxes and the virial mass. In the upper panel we show M vs. Mvir, in the lower one M vs. αvir (=Mvir/M). Each group of sources is shown with a different symbol and colour, as indicated. The stars refer to sources of subsample S3, while their colour still identifies the group (red = IRB, green = RMS, black = D8, and blue = D24). A typical uncertainty (for subsamples S1 and S2) is shown in the top left or right corner. The dashed and dotted lines indicate Mvir = M and Mvir = 2M, respectively (see text).
Current usage metrics show cumulative count of Article Views (full-text article views including HTML views, PDF and ePub downloads, according to the available data) and Abstracts Views on Vision4Press platform.
Data correspond to usage on the plateform after 2015. The current usage metrics is available 48-96 hours after online publication and is updated daily on week days.
Initial download of the metrics may take a while.