Fig. 12
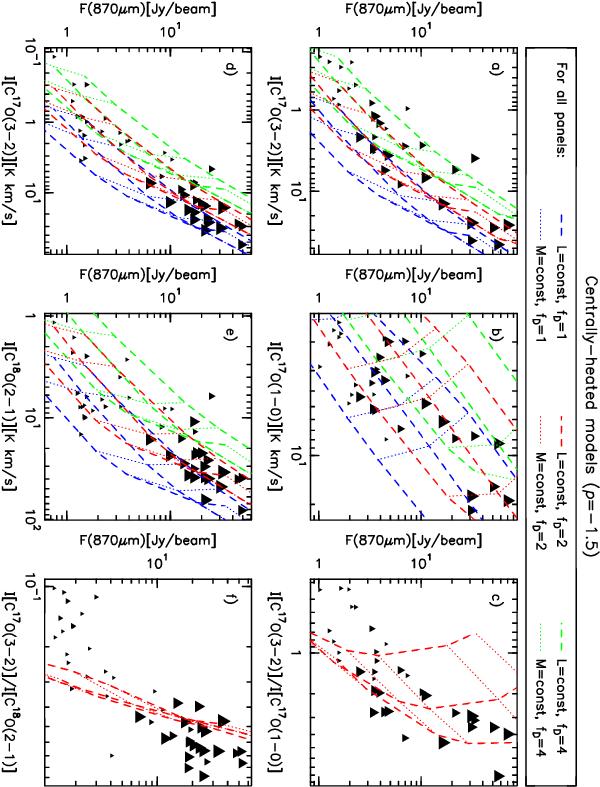
Line and continuum fluxes of the sources, compared to grids of centrally heated models for typical sources parameters (D = 4 kpc, ΔV = 4 km s-1, Reff = 1 pc, n ∝ r-1.5), convolved with the appropriate beam. The size of the symbol is proportional to the logarithm of MSX flux in band E (21 μm). The grids include a central object heating the gas, and differ for depletion factors identified with different colours, indicated above the panels (blue: fD = 1, red: fD = 2, green: fD = 4). In each panel, the dashed lines connect models with constant luminosity of the central object (three lines, from 102L⊙ to 105L⊙) and varying mass. In a similar way, the dotted lines connect models with the same mass (six lines from ~ 200 M⊙ to ~ 45 000 M⊙) and varying luminosity of the central object. Panels a) to c) refer to subsample S1, panels d) to f) to subsample S2.
Current usage metrics show cumulative count of Article Views (full-text article views including HTML views, PDF and ePub downloads, according to the available data) and Abstracts Views on Vision4Press platform.
Data correspond to usage on the plateform after 2015. The current usage metrics is available 48-96 hours after online publication and is updated daily on week days.
Initial download of the metrics may take a while.