Fig. 2
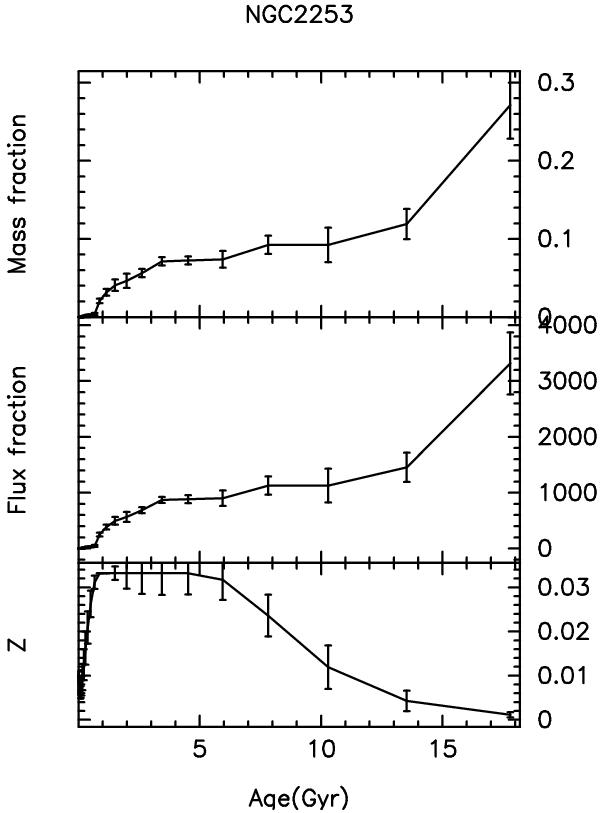
Typical output of STECKMAP for the central spectrum of NGC 2253. Top panel: mass fraction of stars of different ages; middle panel: flux fraction; bottom panel: evolution of metallicity Z. The error bars represent the root-mean-square dispersion from the mean, of a series of 250 Monte Carlo simulations where each pixel of the spectrum is perturbed with noise following a Gaussian distribution of width given by the error spectrum.
Current usage metrics show cumulative count of Article Views (full-text article views including HTML views, PDF and ePub downloads, according to the available data) and Abstracts Views on Vision4Press platform.
Data correspond to usage on the plateform after 2015. The current usage metrics is available 48-96 hours after online publication and is updated daily on week days.
Initial download of the metrics may take a while.