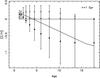
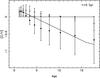
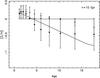
Fig. A.1

Age metallicity relation for a simulated exponential star formation history with different τ and with two different chemical evolution models. Solid lines indicate the simulated age-metallicity relation whilst the points show the recovered values. Open symbols shows the recovered age-metallicity relation in the case of constant metallicity with age whilst the filled symbols show the recovered age-metallicity relation in the case where the metallicity increase with time. Error bars represent the rms dispersion of a set of 50 Monte Carlo simulations where each pixel is moved according to a Gaussian distribution of width given by the errors. The synthetic spectra have been degraded to the resolution of the data and noise have been added to simulate a S/N per Å of 40.

Current usage metrics show cumulative count of Article Views (full-text article views including HTML views, PDF and ePub downloads, according to the available data) and Abstracts Views on Vision4Press platform.
Data correspond to usage on the plateform after 2015. The current usage metrics is available 48-96 hours after online publication and is updated daily on week days.
Initial download of the metrics may take a while.