Fig. 1
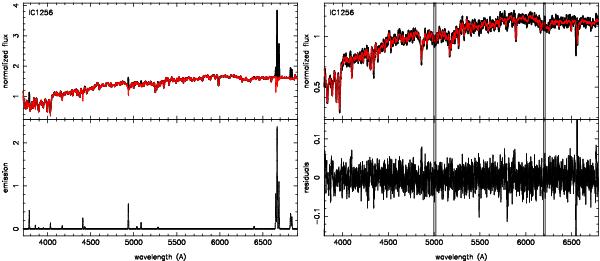
Left panel – top panel: original observed central spectrum (central spaxel) of IC 1256 (black line) and the one corrected from emission using GANDALF (red line). Bottom panel: emission line spectrum. Right panel – top panel: fit to the central spectra of the galaxies from the sample (red line). Bottom panel: residuals from the fit. Masked areas are indicated with vertical lines.
Current usage metrics show cumulative count of Article Views (full-text article views including HTML views, PDF and ePub downloads, according to the available data) and Abstracts Views on Vision4Press platform.
Data correspond to usage on the plateform after 2015. The current usage metrics is available 48-96 hours after online publication and is updated daily on week days.
Initial download of the metrics may take a while.