Fig. 2
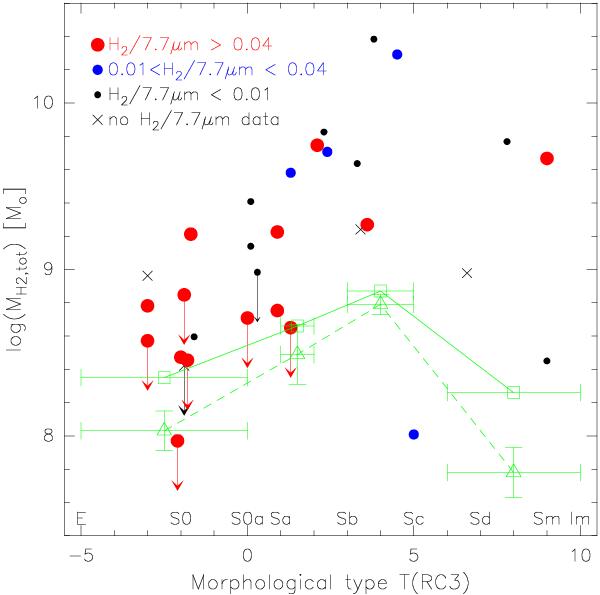
Total extrapolated molecular gas mass, MH2,tot, as a function of morphological type. Galaxies classified as MOHEGs (H2/7.7 μm ≥ 0.04) are shown as large red circles, non-MOHEG galaxies with 0.01 < H2/7.7 μm < 0.04 as smaller blue circles, galaxies with H2/7.7 μm < 0.01 as black dots and galaxies with no warm H2 data are black crosses. The green symbols denote means (triangles) and medians (squares) for a sample of isolated galaxies (Lisenfeld et al. 2011). The mean, respectively median, are taken for the interval of morphological types shown by the horizontal bar.
Current usage metrics show cumulative count of Article Views (full-text article views including HTML views, PDF and ePub downloads, according to the available data) and Abstracts Views on Vision4Press platform.
Data correspond to usage on the plateform after 2015. The current usage metrics is available 48-96 hours after online publication and is updated daily on week days.
Initial download of the metrics may take a while.