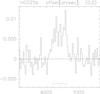
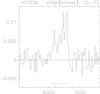
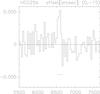
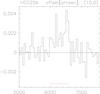
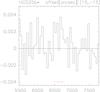
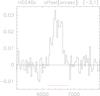
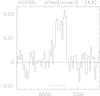
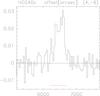
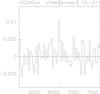
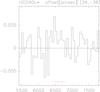
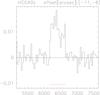
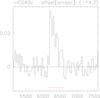
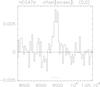
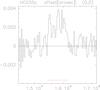
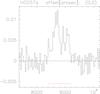
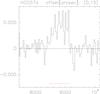
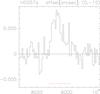
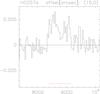
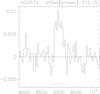
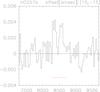
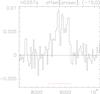
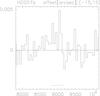
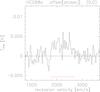
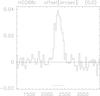
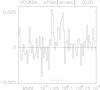
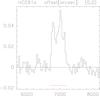
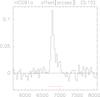
Fig. A.1
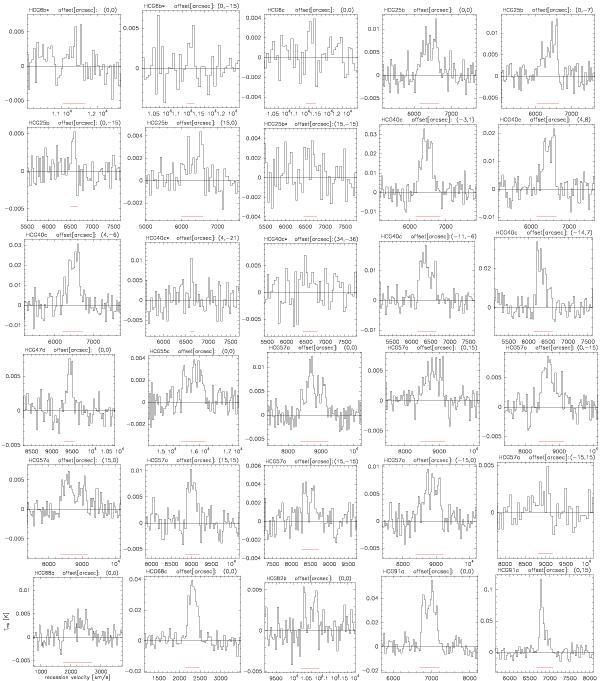
CO(1–0) spectra of the detected (including tentative detections) spectra. The velocity resolution is ~32 km s-1 for most spectra and ~48 km s-1 for some cases where a lower resolution was required to clearly see the line. The red line segment shows the zero-level line width of the CO line adopted for the determination of the velocity integrated intensity. An asterisk next to the name indicates a tentative detection.
Current usage metrics show cumulative count of Article Views (full-text article views including HTML views, PDF and ePub downloads, according to the available data) and Abstracts Views on Vision4Press platform.
Data correspond to usage on the plateform after 2015. The current usage metrics is available 48-96 hours after online publication and is updated daily on week days.
Initial download of the metrics may take a while.