Fig. 12
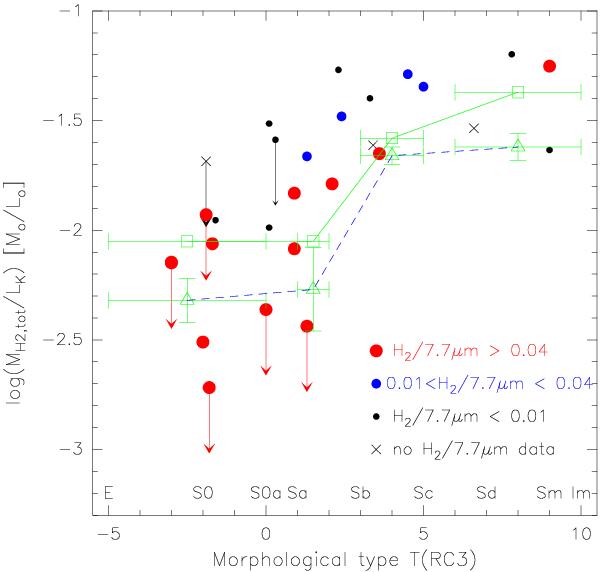
Ratio between total extrapolated molecular gas mass, MH2,tot, and luminosity in the K band, LK, as a function of morphological type. The green symbols denote means (triangles) and medians (squares) for a sample of isolated galaxies (Lisenfeld et al. 2011). The mean, respectively median, are taken for the interval of morphological types shown by the horizontal bar.
Current usage metrics show cumulative count of Article Views (full-text article views including HTML views, PDF and ePub downloads, according to the available data) and Abstracts Views on Vision4Press platform.
Data correspond to usage on the plateform after 2015. The current usage metrics is available 48-96 hours after online publication and is updated daily on week days.
Initial download of the metrics may take a while.