Fig. 6
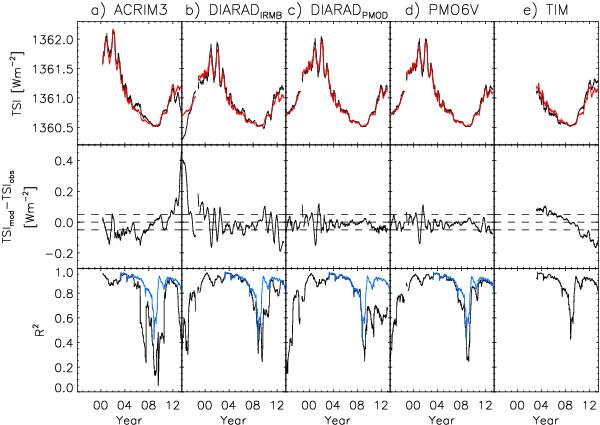
Top: 181-day moving average of the five TSI records examined (black) and the corresponding candidate TSI reconstruction (red). Middle: the difference between the two, TSImod − TSIobs. The dashed lines mark the zero level and TSImod − TSIobs = ± 0.05 Wm-2. Bottom: the R2 between measured and modelled TSI within a 361-day window centred on each data day. The TIM series is plotted over the other series in blue for comparison.
Current usage metrics show cumulative count of Article Views (full-text article views including HTML views, PDF and ePub downloads, according to the available data) and Abstracts Views on Vision4Press platform.
Data correspond to usage on the plateform after 2015. The current usage metrics is available 48-96 hours after online publication and is updated daily on week days.
Initial download of the metrics may take a while.