Fig. 15
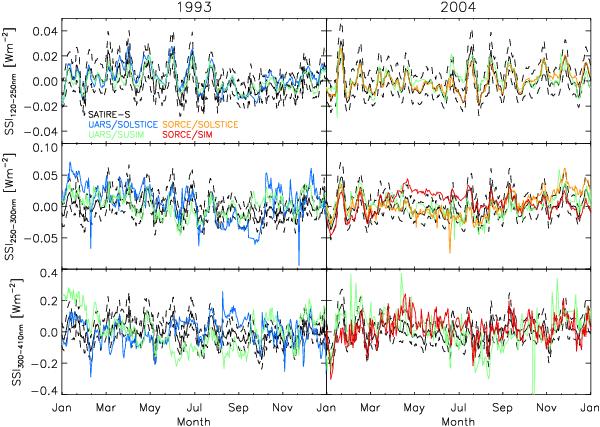
Rotational variability in the reconstruction and in the spectral measurements from UARS and SORCE over the same spectral intervals as in Fig. 14 (except we combined the 120 to 180 nm and 180 to 250 nm intervals, where the relative agreement between the various time series is similar) during 1993 and 2004. The rotational variability was isolated by taking the integrated flux over each spectral interval and subtracting the corresponding 361-moving average. The dashed lines represent the reconstruction uncertainty.
Current usage metrics show cumulative count of Article Views (full-text article views including HTML views, PDF and ePub downloads, according to the available data) and Abstracts Views on Vision4Press platform.
Data correspond to usage on the plateform after 2015. The current usage metrics is available 48-96 hours after online publication and is updated daily on week days.
Initial download of the metrics may take a while.