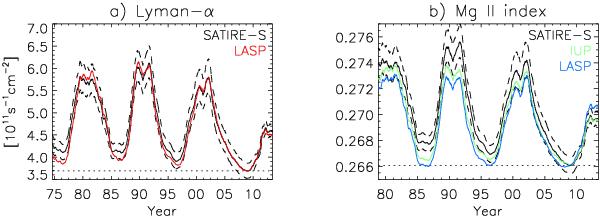
Fig. 12

361-day moving average of the a) Lyman-α irradiance and the b) Mg II index. The various composites by IUP and by LASP were matched in terms of the rotational variability and the level at the 2008 solar cycle minimum (dotted lines) to the SATIRE-S reconstruction to allow a direct comparison of the overall trends. The dashed lines indicate the lower and upper uncertainty of the Lyman-α irradiance and Mg II index taken from the reconstruction.
Current usage metrics show cumulative count of Article Views (full-text article views including HTML views, PDF and ePub downloads, according to the available data) and Abstracts Views on Vision4Press platform.
Data correspond to usage on the plateform after 2015. The current usage metrics is available 48-96 hours after online publication and is updated daily on week days.
Initial download of the metrics may take a while.


