Fig. 4
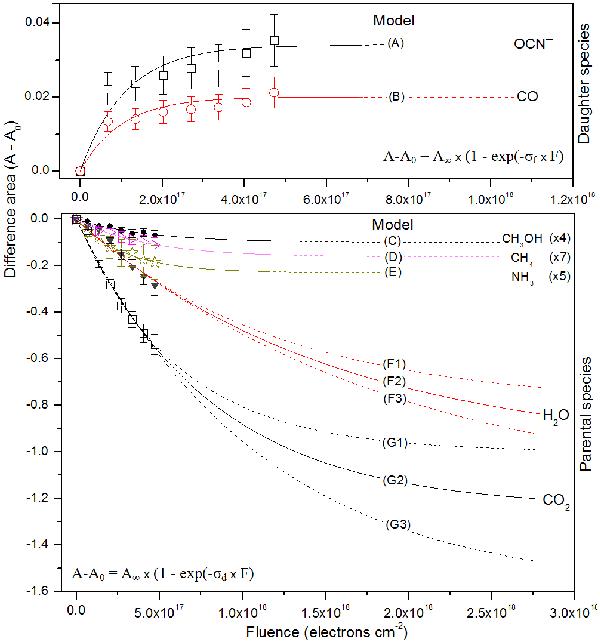
Difference area over the fluence. The upper panel shows the fit for the two most abundant daughter species, the bottom panel shows the fit for selected bands of parental species. The points are the experimentally obtained values and the lines are the best fit using Eq. (17). The difference areas of CH3OH, CH4, and NH3 were multiplied by a constant, as indicated, for better visualization. However, the values of A∞ and the cross-section of these species were calculated from the original data. The results from models Fn and Gn are shown in Table 5. In this figure, higher amplitude does not mean higher destruction or formation of the molecules.
Current usage metrics show cumulative count of Article Views (full-text article views including HTML views, PDF and ePub downloads, according to the available data) and Abstracts Views on Vision4Press platform.
Data correspond to usage on the plateform after 2015. The current usage metrics is available 48-96 hours after online publication and is updated daily on week days.
Initial download of the metrics may take a while.