Fig. 13
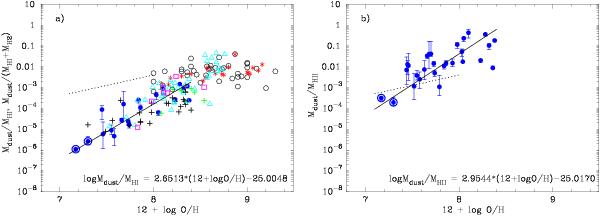
a) Dependence of the dust-to-hydrogen mass ratio relative to the oxygen abundance 12 + log O/H. The data from this paper are shown by large filled blue circles and are fitted by the linear maximum-likelihood regression (black solid line). The two lowest-metallicity galaxies, I Zw 18 and SBS 0335–052E, are encircled. The dust-to-gas ratio from a compiled sample of dwarf irregulars and blue compact dwarf (BCD) galaxies by Lisenfeld & Ferrara (1998; IRAS data) are denoted by black crosses (note that for GR8 we adopt the oxygen abundance from Morales-Luis et al. 2011). The data for 16 BCDs (IRAS data) by Hirashita et al. (2002) are shown by magenta open squares. The dust-to-gas ratio for 66 star-forming galaxies observed with Spitzer by Engelbracht et al. (2008) are shown by light blue triangles. The data compiled from literature for a wide sample of galaxies using different submm (>160 μm) observations (Galametz et al. 2011) are denoted by large open black circles. The available data gathered by James et al. (2002) and their observations with SCUBA are shown by red asterisks. b) Dependence of the dust-to-ionised-hydrogen mass ratio relative to the oxygen abundance 12 + log O/H. The data from this paper are shown by large filled blue circles and are fitted by the linear maximum-likelihood regression (black solid line). The two lowest-metallicity galaxies, I Zw 18 and SBS 0335–052E, are encircled. The black dotted lines in both panels denote a one-to-one correspondence between the dust-to-gas mass ratio and the heavy-element mass fraction Zion (see Eq. (5)) in the ionised gas as derived from the oxygen abundance.
Current usage metrics show cumulative count of Article Views (full-text article views including HTML views, PDF and ePub downloads, according to the available data) and Abstracts Views on Vision4Press platform.
Data correspond to usage on the plateform after 2015. The current usage metrics is available 48-96 hours after online publication and is updated daily on week days.
Initial download of the metrics may take a while.