Fig. 9
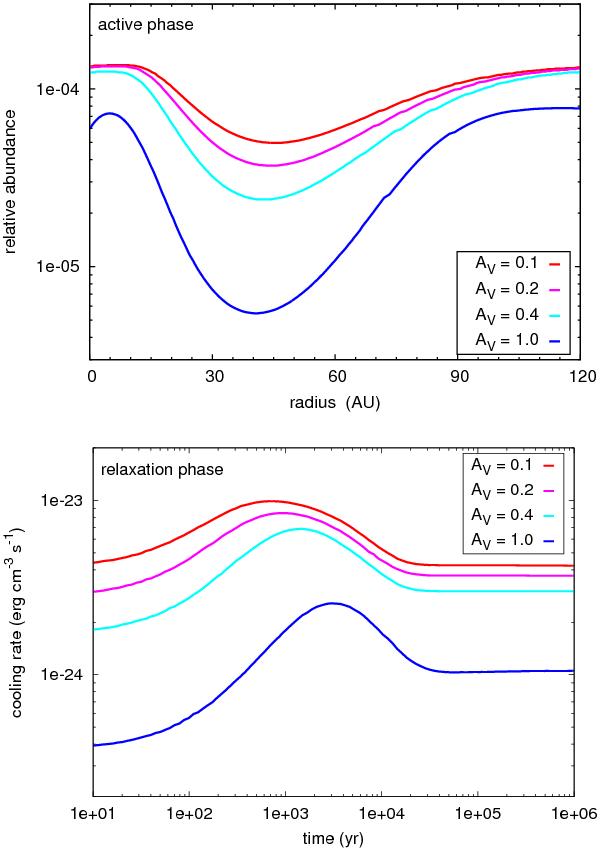
Top panel: C+ relative abundance as a function of the distance from the vortex axis during the active stage of the TDR model. Bottom panel: cooling rate associated with the  transition of C+ as a function of time during the relaxation stage of the TDR model. The model is computed for nH = 100 cm-3, a = 10-11 s-1, and several values of the visible extinction AV: 0.1 (red), 0.2 (magenta), 0.4 (cyan), and 1.0 (blue) mag.
Current usage metrics show cumulative count of Article Views (full-text article views including HTML views, PDF and ePub downloads, according to the available data) and Abstracts Views on Vision4Press platform.
Data correspond to usage on the plateform after 2015. The current usage metrics is available 48-96 hours after online publication and is updated daily on week days.
Initial download of the metrics may take a while.