Fig. 6
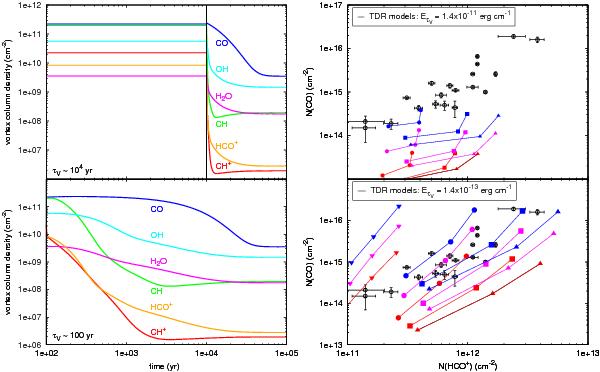
Left panels: column densities of selected species integrated across a single vortex as functions of time during the isochoric relaxation phase. The models are computed for two values of the vortex dissipation integral EτV = 1.4 × 10⁻¹¹ erg cm-1 (top panels) and EτV = 1.4 × 10⁻¹³ erg cm-1 (bottom panels). The corresponding vortex lifetimes are indicated with vertical straight lines. All the other parameters are set to their standard values. Right panels: comparison of observations with the predictions of TDR models. The observed CO and HCO+ column densities (open circles) are from Lucas & Liszt (1996); Liszt & Lucas (1998, 2004). The predictions of the TDR models (filled symbols) are shown for AV = 0.2 (red), 0.4 (magenta), and 0.8 (blue) mag, nH = 30 (triangles), nH = 50 (squares), nH = 100 (circles), and nH = 300 cm-3 (upside-down triangles), and a total column density NH = 1.8 × 1021 cm-2; along each curve, the rate-of-strain a varies between 10-11 (right) and 10-10 s-1 (left).
Current usage metrics show cumulative count of Article Views (full-text article views including HTML views, PDF and ePub downloads, according to the available data) and Abstracts Views on Vision4Press platform.
Data correspond to usage on the plateform after 2015. The current usage metrics is available 48-96 hours after online publication and is updated daily on week days.
Initial download of the metrics may take a while.