Fig. 5
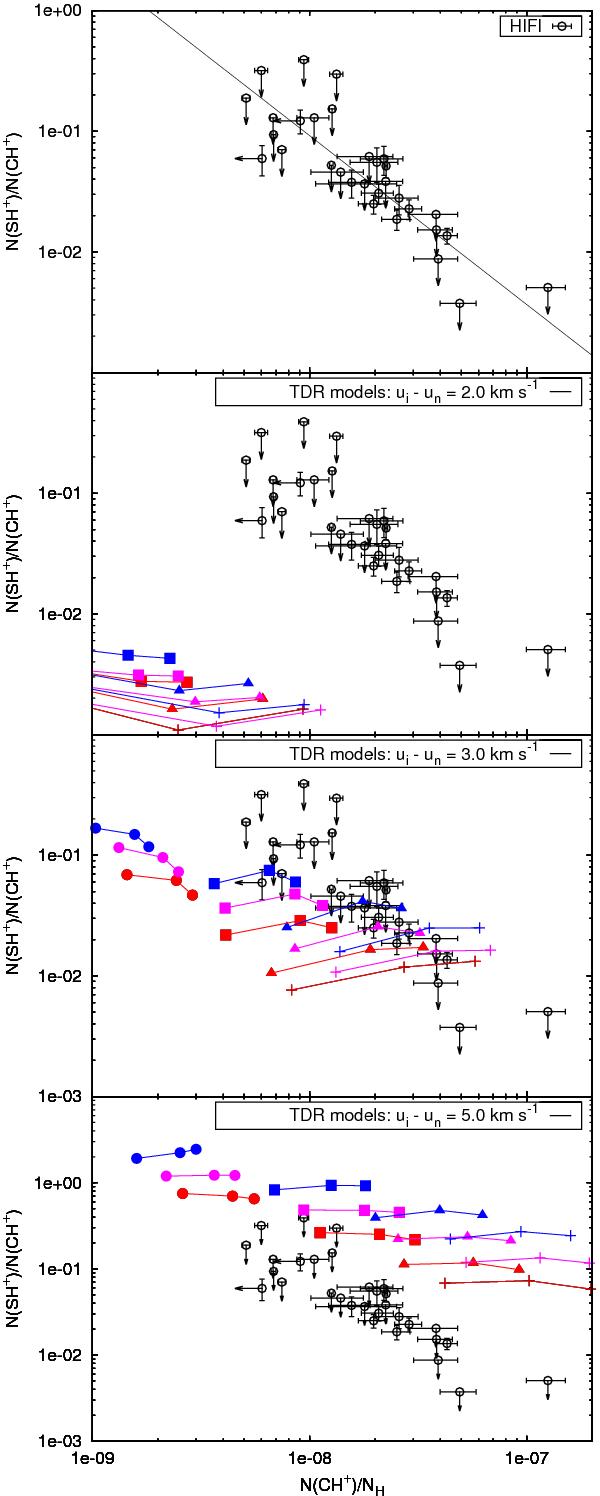
Observations (top panel) compared to the predictions of TDR models computed for three values of the maximum ion-neutral velocity drift: starting from the second panel, ui − un = 2.0, 3.0, and 5.0 km s-1. Data (open circles) − the CH+ and SH+ column densities and the least-squares power-law fit of their ratio (black line) are from Godard et al. (2012). Model predictions (filled symbols) − computed for AV = 0.1 (red), 0.2 (magenta), and 0.4 (blue) mag and for several densities: 20 (crosses), 30 (triangles), 50 (squares), and 100 cm-3 (circles). Along each curve, the rate-of-strain a varies between 10-11 and 10-10 s-1 from right to left.
Current usage metrics show cumulative count of Article Views (full-text article views including HTML views, PDF and ePub downloads, according to the available data) and Abstracts Views on Vision4Press platform.
Data correspond to usage on the plateform after 2015. The current usage metrics is available 48-96 hours after online publication and is updated daily on week days.
Initial download of the metrics may take a while.