Fig. 4
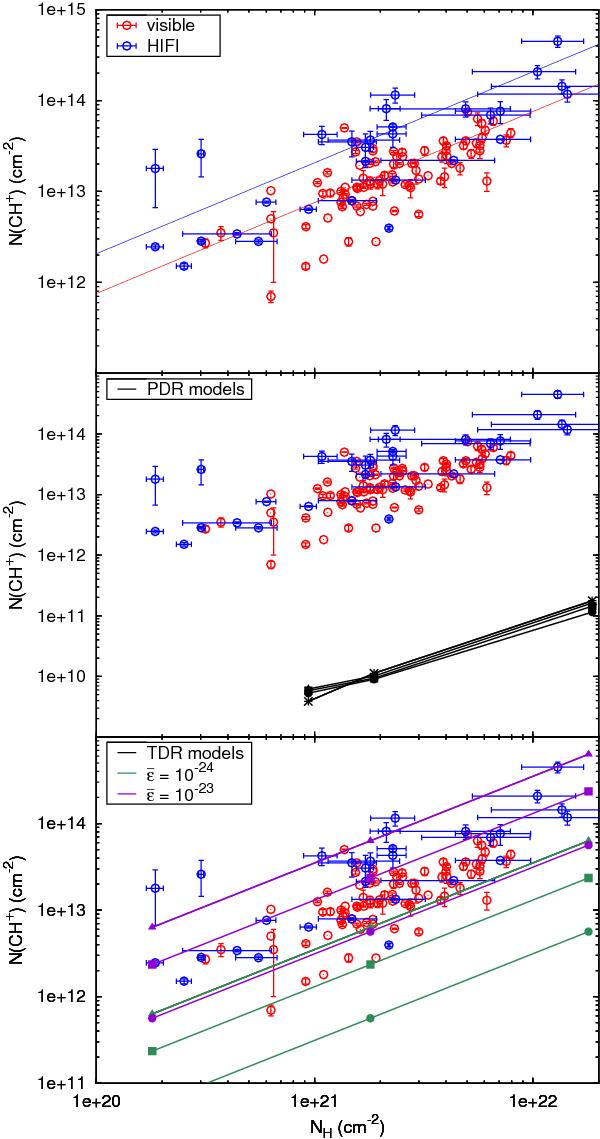
Observations (top panel) compared to the predictions of PDR (middle panel) and TDR (bottom panel) models. Data (open circles) − The CH+ and total hydrogen column densities inferred from visible absorption lines and extinction measurements are shown in red and are from Crane et al. (1995), Gredel (1997), and Weselak et al. (2008). The CH+ and total hydrogen column densities inferred from the far-infrared absorption lines of CH+, HF, and CH and the 21 cm emission lines of HI are shown in blue and are from Falgarone et al. (2010a), Gerin et al. (2010b), Neufeld et al. (2010b), Sonnentrucker et al. (2010), and Godard et al. (2012). The red and blue lines correspond to the mean ratio N(CH+) /NH computed with the visible and submillimetre data, respectively. PDR and TDR model predictions (filled symbols) − Computed for several densities: 10 (crosses), 30 (triangles), 50 (squares), and 100 cm-3 (circles). The TDR models are computed for  (green) and 10-23 (magenta) erg cm-3 s-1, all the other parameters are set to their standard values.
Current usage metrics show cumulative count of Article Views (full-text article views including HTML views, PDF and ePub downloads, according to the available data) and Abstracts Views on Vision4Press platform.
Data correspond to usage on the plateform after 2015. The current usage metrics is available 48-96 hours after online publication and is updated daily on week days.
Initial download of the metrics may take a while.