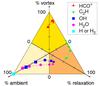
Fig. 3
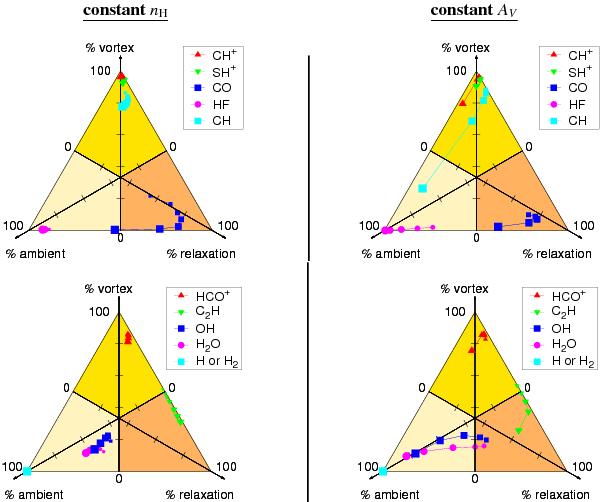
Ternary phase diagram of the TDR model. The projections of each point on the medians of the equilateral triangle show the contributions of each phase (ambient medium, active dissipative bursts, and relaxation stages) to the total column density of a given species. In the left panels, the models are computed for several values of AV: 0.1, 0.2, 0.3, 0.4, 0.6, 0.8, and 1.0 mag. In the right panels, the models are computed for several values of nH: 20, 30, 50, 100, and 300 cm-3. All the other parameters are set to their standard values (see Table 1). In all panels, the size of the symbols increases as the varying parameter increases. The beige, yellow, and orange zones indicate the regions where the production of the different species is dominated by the ambient medium, the active vortices, and the relaxation stages, respectively.
Current usage metrics show cumulative count of Article Views (full-text article views including HTML views, PDF and ePub downloads, according to the available data) and Abstracts Views on Vision4Press platform.
Data correspond to usage on the plateform after 2015. The current usage metrics is available 48-96 hours after online publication and is updated daily on week days.
Initial download of the metrics may take a while.