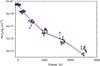
Fig. 10
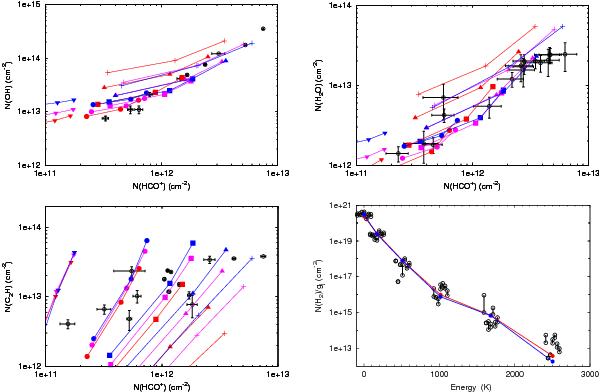
Observations compared to TDR model predictions. Data (open circles): column densities of HCO+ and OH from Lucas & Liszt (1996; top left panel), H2O from Flagey et al. (2013; top right panel), C2H from Lucas & Liszt (2000; bottom left panel), and the excited levels of H2 from Gry et al. (2002) and Lacour et al. (2005; bottom right panel). For clarity, in the bottom right panel the points for a given level are slightly shifted on the abscissa. Models (filled symbols): computed for AV = 0.2 (red), 0.4 (magenta), and 0.6 (blue) mag and nH = 20 (crosses), 30 (triangles), 50 (squares), 100 (circles), and 300 (upside-down triangles) cm-3. Except for the bottom right panel, a increases along each curve from 10-11 to 10-10 s-1 from right to left. In the bottom right panel, the models are shown for AV = 0.1 mag (red) and 0.4 mag (blue) and single values of the rate-of-strain a = 3 × 10-11 s-1 and the density nH = 100 cm-3.
Current usage metrics show cumulative count of Article Views (full-text article views including HTML views, PDF and ePub downloads, according to the available data) and Abstracts Views on Vision4Press platform.
Data correspond to usage on the plateform after 2015. The current usage metrics is available 48-96 hours after online publication and is updated daily on week days.
Initial download of the metrics may take a while.