Fig. 1
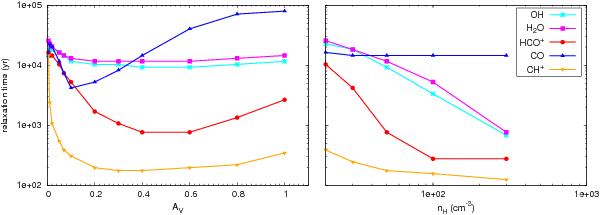
Relaxation timescales (Eq. (3)) of OH (cyan crosses), H2O (magenta squares), HCO+ (red circles), CO (blue triangles), and CH+ (orange upside-down triangles) computed with the TDR model as functions of the shielding AV of the UV field (left panel) and the density nH of the gas (right panel), all the other parameters being set to their standard values (see Table 1).
Current usage metrics show cumulative count of Article Views (full-text article views including HTML views, PDF and ePub downloads, according to the available data) and Abstracts Views on Vision4Press platform.
Data correspond to usage on the plateform after 2015. The current usage metrics is available 48-96 hours after online publication and is updated daily on week days.
Initial download of the metrics may take a while.