Fig. 1
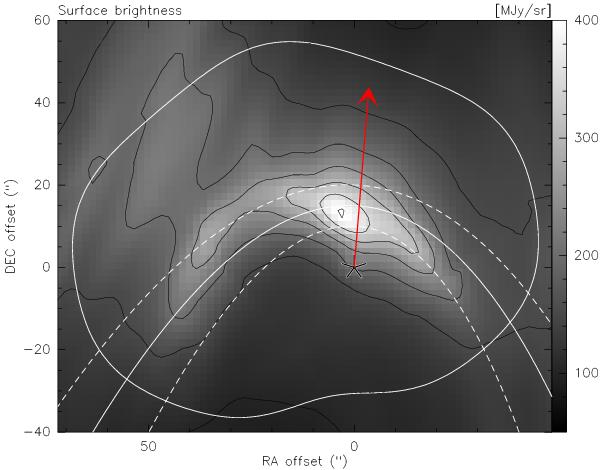
Spitzer 24μm image toward HD 34078, from (France et al. 2007). Contours are equally spaced every 50 MJy / sr, starting from 100 MJy / sr. Offsets are measured from the star position, displayed as a black star. The red arrow represents the star on-sky proper motion for the next 1000 years. The solid open white curve displays a parabola pointing in this direction, with its focus at the star and a projected star-apex distance Robs = 15′′ (see Appendix A for a description of projection effects in a paraboloid). The two dashed curves correspond to variations of Robs by ± 5″. The closed white contour corresponds to the region mapped with the PdBI interferometer. The right ascension axis increases toward the left.
Current usage metrics show cumulative count of Article Views (full-text article views including HTML views, PDF and ePub downloads, according to the available data) and Abstracts Views on Vision4Press platform.
Data correspond to usage on the plateform after 2015. The current usage metrics is available 48-96 hours after online publication and is updated daily on week days.
Initial download of the metrics may take a while.