Fig. 14
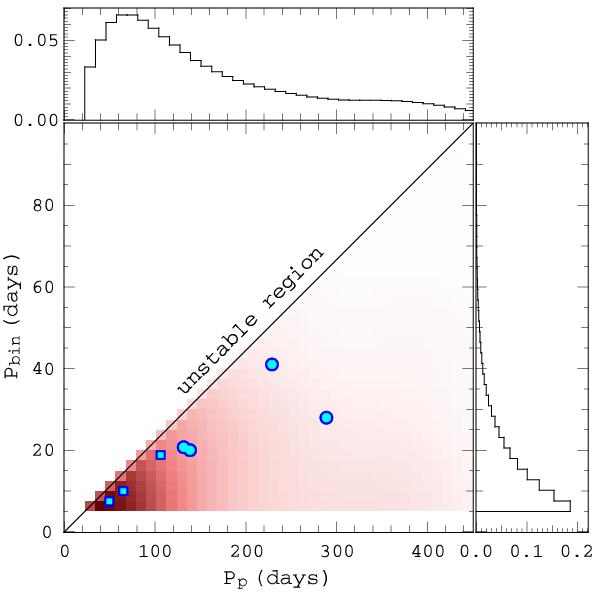
A smoothed 2D probability distribution function of planets consecutively transiting eclipsing binaries, having a mutual inclination following a 1° Rayleigh function. The darker the colour, the more probable planets are. Blue dots indicate Kepler-16, -34, -35, and -64. Squares are for the other circumbinary systems which fall outside the bounds of our simulation. Only the innermost circumbinary planets are shown. The black line delineates an approximation of the stability limit Pp = 4.5 Pbin. Side histograms give the marginalised probabilities.
Current usage metrics show cumulative count of Article Views (full-text article views including HTML views, PDF and ePub downloads, according to the available data) and Abstracts Views on Vision4Press platform.
Data correspond to usage on the plateform after 2015. The current usage metrics is available 48-96 hours after online publication and is updated daily on week days.
Initial download of the metrics may take a while.