Free Access
Fig. 5
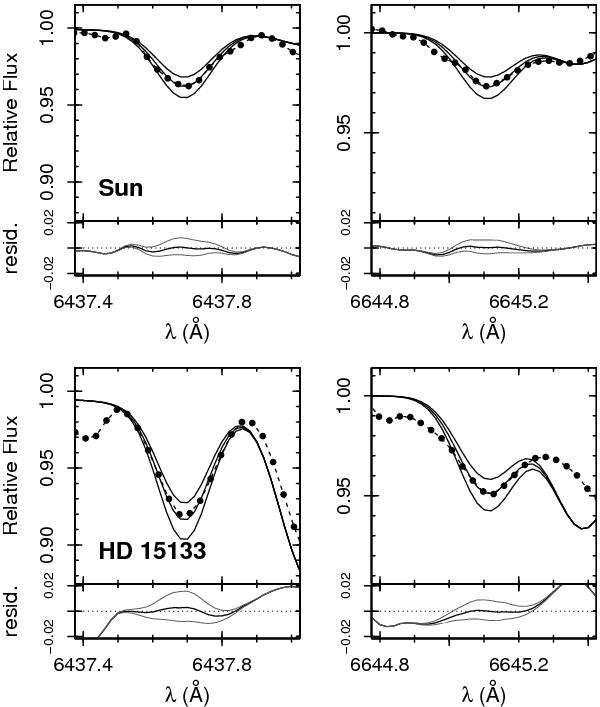
Profiles of the Eu ii line at 6437 Å and 6645 Å. Upper panels: solar spectrum. Solid lines indicate the synthetic spectra for ϵ(Eu) = 0.41, 0.51, 0.61; the dots indicate the observed spectrum. Lower panels: spectrum synthesis fitting of Eu ii lines for HD 15133.
This figure is made of several images, please see below:
Current usage metrics show cumulative count of Article Views (full-text article views including HTML views, PDF and ePub downloads, according to the available data) and Abstracts Views on Vision4Press platform.
Data correspond to usage on the plateform after 2015. The current usage metrics is available 48-96 hours after online publication and is updated daily on week days.
Initial download of the metrics may take a while.