Free Access
Fig. 8
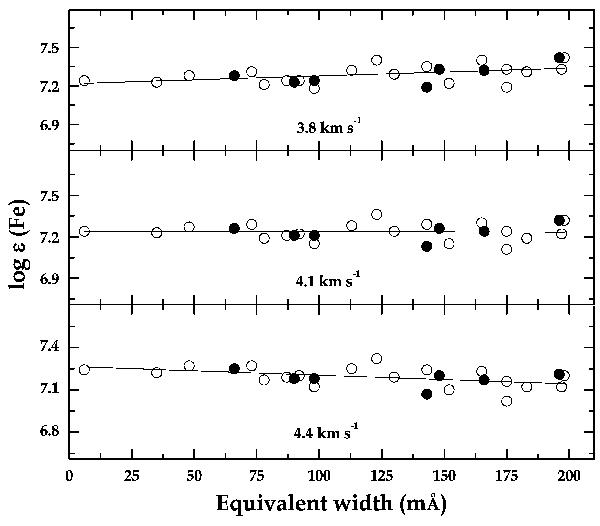
Abundances derived from the Fe i and Fe ii (neutral lines – open circles; ionized lines – filled circles) lines in red wavelength region plotted vs. the EW of the line, illustrating the estimation of the microturbulent velocity for HD 50975A.
Current usage metrics show cumulative count of Article Views (full-text article views including HTML views, PDF and ePub downloads, according to the available data) and Abstracts Views on Vision4Press platform.
Data correspond to usage on the plateform after 2015. The current usage metrics is available 48-96 hours after online publication and is updated daily on week days.
Initial download of the metrics may take a while.