Fig. 7
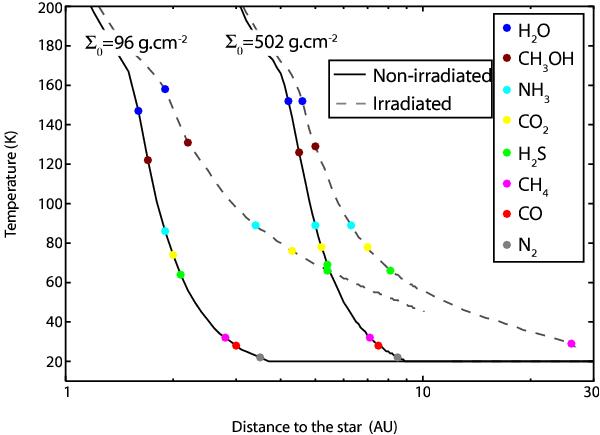
Final temperature profile of irradiated (dashed grey lines) and non-irradiated (black lines) discs for two particular simulations (Σ0 = 95.844 g cm-2, acore = 46, γ = 0.9; and Σ0 = 502.52 g cm-2, acore = 80, γ = 0.9) as a function of the distance to the star. Coloured dots represent the ice line positions of H2O, CH3OH, NH3, CO2, H2S, CH4, CO, and N2. Models without clathrates.
Current usage metrics show cumulative count of Article Views (full-text article views including HTML views, PDF and ePub downloads, according to the available data) and Abstracts Views on Vision4Press platform.
Data correspond to usage on the plateform after 2015. The current usage metrics is available 48-96 hours after online publication and is updated daily on week days.
Initial download of the metrics may take a while.