Fig. 21
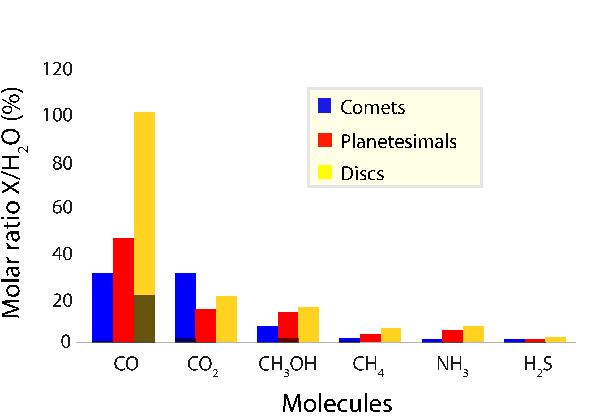
Minimum (dark area) and maximum (light area) molar ratios of species x relative to H2O from the gas phase of the disc (yellow area), icy planetesimals (red area), and observations of comets (blue area). Results take into account all the irradiated and non-irradiated models.
Current usage metrics show cumulative count of Article Views (full-text article views including HTML views, PDF and ePub downloads, according to the available data) and Abstracts Views on Vision4Press platform.
Data correspond to usage on the plateform after 2015. The current usage metrics is available 48-96 hours after online publication and is updated daily on week days.
Initial download of the metrics may take a while.