Fig. 19
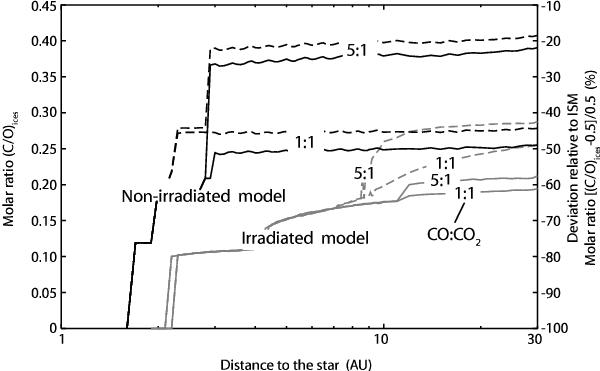
Molar ratio C:O in ices (left scale) and its deviation relative to the solar abundance (right scale), for one particular simulation (Σ0 = 95.844 g cm-2, acore = 46, γ = 0.9), as a function of the distance to the star, and for non-irradiated (black lines) and irradiated (grey lines) models, including chemical variation (CO:CO2 molar ratio), and with (dashed lines) and without (solid lines) clathrates.
Current usage metrics show cumulative count of Article Views (full-text article views including HTML views, PDF and ePub downloads, according to the available data) and Abstracts Views on Vision4Press platform.
Data correspond to usage on the plateform after 2015. The current usage metrics is available 48-96 hours after online publication and is updated daily on week days.
Initial download of the metrics may take a while.