Fig. 6
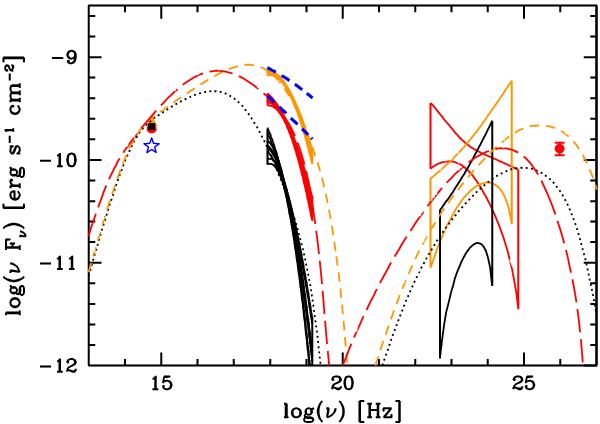
Spectral energy distributions of Mkn 421 at the average UT epochs of 16.1–16.5 (red circle) and 17.1–17.4 (orange triangle) April 2013 and during the quiescent state (black square), that we relate here to the minimum Fermi-LAT flux of April 19.0–19.5, from simultaneous INTEGRAL IBIS/ISGRI, JEM-X and OMC, and Fermi-LAT data. The optical data were corrected for Galactic absorption and for the contamination by galaxies in the field as described in the text. The 1σ error contours of the joint JEM-X and IBIS/ISGRI spectra and LAT spectra are reported. The TeV point (red) was taken on April 16.3 and is the last point of the VERITAS observation (Mukherjee 2013; still preliminary). The models (long dash: April 16, short dash: April 17, dot: April 19) include a synchrotron component at the lower energies, produced in a single emitting zone, and a synchrotron self-Compton scattering component at higher energies (see model parameters in Table 4). For comparison, the JEM-X and IBIS/ISGRI quiescent and active state spectra of June 2006 (Table 7 in Lichti et al. 2008) are reported as thick dashed blue lines. The average optical flux at the same epoch is shown as a blue star.
Current usage metrics show cumulative count of Article Views (full-text article views including HTML views, PDF and ePub downloads, according to the available data) and Abstracts Views on Vision4Press platform.
Data correspond to usage on the plateform after 2015. The current usage metrics is available 48-96 hours after online publication and is updated daily on week days.
Initial download of the metrics may take a while.