Fig. 5
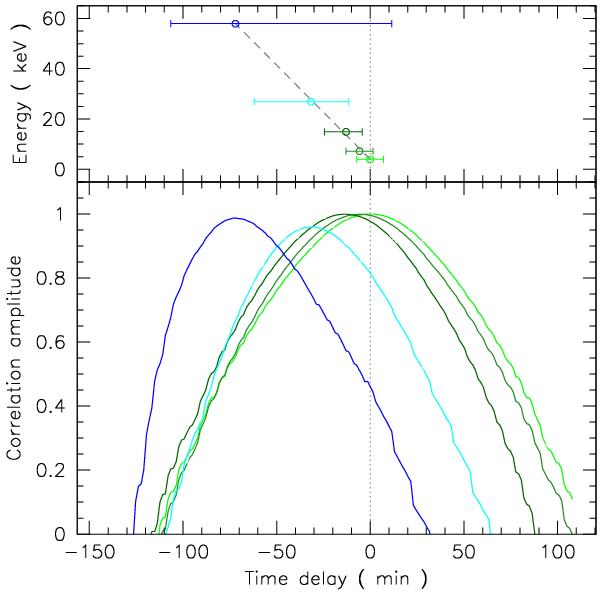
Cross-correlation function of the INTEGRAL JEM-X (the outputs of the 2 detectors have been coadded) and IBIS/ISGRI light curves during the onset and first peak of the main outburst (April 17.03–17.21 UT). Bottom panel: correlation curves of JEM-X data in the softest range (3.04–5.52 keV) with itself and with the light curves at higher energies, identified by the same colours as in Fig. 1. Top panel: corresponding correlation time lags as a function of energy (same colour–coding as in bottom panel) with 1σ uncertainties based on the distribution of lags obtained by perturbing the original light curves (see text). The energy was evaluated by calculating the average photon energy in the spectral band assuming a photon index of Γ = 2.8, as obtained by a single power law fit to the combined JEM-X and IBIS/ISGRI overall spectra. The dashed line in the upper panel simply connects the first and last points to visualise the trend.
Current usage metrics show cumulative count of Article Views (full-text article views including HTML views, PDF and ePub downloads, according to the available data) and Abstracts Views on Vision4Press platform.
Data correspond to usage on the plateform after 2015. The current usage metrics is available 48-96 hours after online publication and is updated daily on week days.
Initial download of the metrics may take a while.