Free Access
Fig. 4
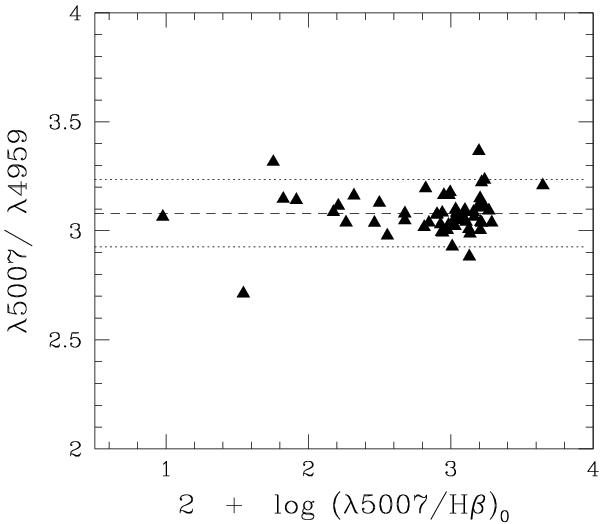
Intensity ratio of the [O iii] λ5007 to λ4959 lines as the function of the flux of [O iii] λ5007 (in units of Hβ). The dashed line represents mean value for the presented observations, and the dotted lines are 5% deviations from it.
Current usage metrics show cumulative count of Article Views (full-text article views including HTML views, PDF and ePub downloads, according to the available data) and Abstracts Views on Vision4Press platform.
Data correspond to usage on the plateform after 2015. The current usage metrics is available 48-96 hours after online publication and is updated daily on week days.
Initial download of the metrics may take a while.