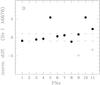
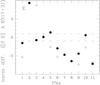
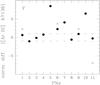
Fig. A.1
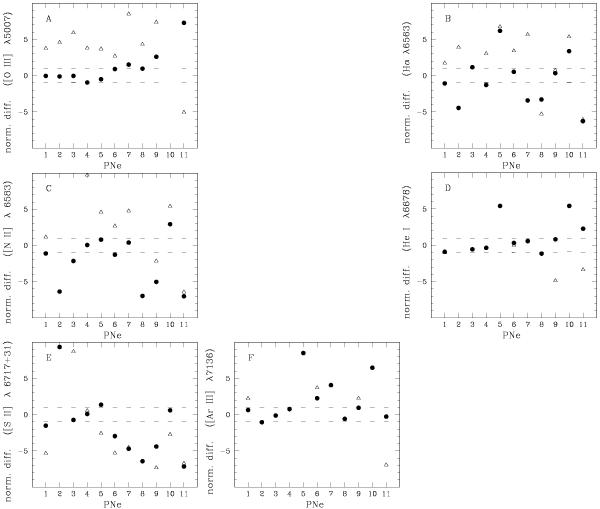
Comparison of our line intensities with measurements of Dopita & Hua (1997) for 11 PNe in common that are listed in Table A.1. The difference for each PNe (identified on horizontal axis) between our measurement and of Dopita & Hua (1997) is marked with a black dot using a normalised scale (vertical axis). The normalisation was done with the original errors from Dopita & Hua (1997). If the normalised absolute difference is less than 1 (dashed lines) our measurements agree within the uncertainty given by the latter authors. Open triangles present an analogous comparison for data from Acker et al. (1992) compared to Dopita & Hua (1997) for the same PNe and are given for reference.
Current usage metrics show cumulative count of Article Views (full-text article views including HTML views, PDF and ePub downloads, according to the available data) and Abstracts Views on Vision4Press platform.
Data correspond to usage on the plateform after 2015. The current usage metrics is available 48-96 hours after online publication and is updated daily on week days.
Initial download of the metrics may take a while.