Fig. 12
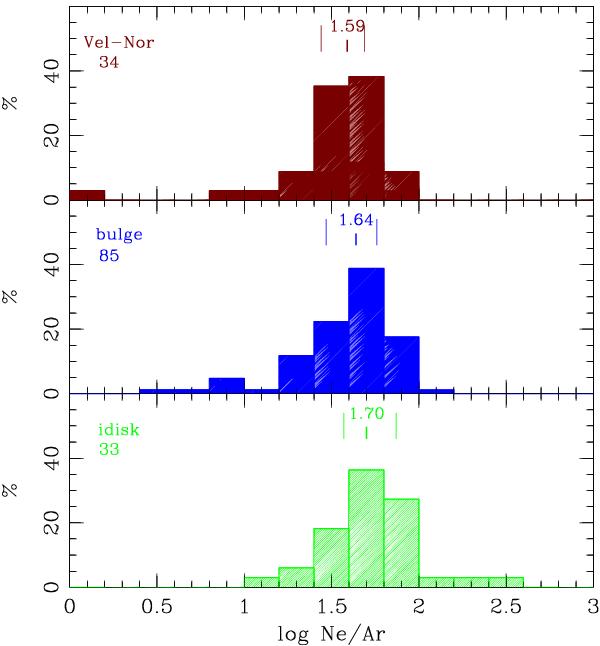
Distributions of the nebular Ne/Ar abundance ratio for the three analysed Galactic samples: disk PNe from Vela-Norma direction (top), bulge PNe (middle), and inner-disk PNe (bottom). The median values, the 25 and 75 percentiles are marked with three short vertical lines above each histogram. Numbers of objects used are shown in the left-hand parts of the panels below sample names.
Current usage metrics show cumulative count of Article Views (full-text article views including HTML views, PDF and ePub downloads, according to the available data) and Abstracts Views on Vision4Press platform.
Data correspond to usage on the plateform after 2015. The current usage metrics is available 48-96 hours after online publication and is updated daily on week days.
Initial download of the metrics may take a while.