Fig. 1
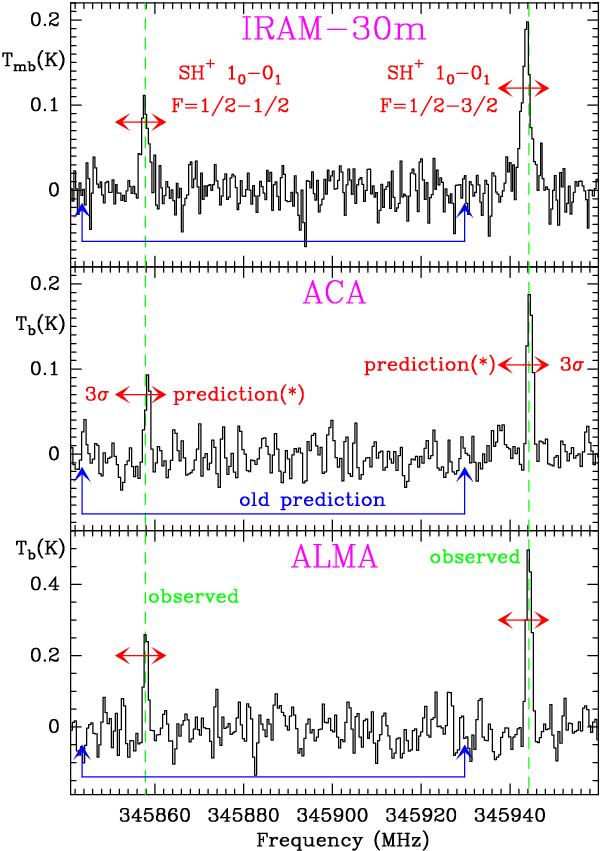
From top to bottom: IRAM 30 m, ACA, and ALMA spectra toward the Orion Bar between 345.8 GHz and 345.9 GHz. Blue arrows show the predicted frequencies of the SH+, NJ = 10−01, F = 1/2−1/2 and F = 1/2−3/2 lines before this work (based on experiments by Savage et al. 2004). Red arrows (prediction*) show the expected line frequencies for a Hamiltonian fit that excludes the 345 929.8 MHz line observed by Savage et al. (2004) and attributed to SH+; see Sect. 4.
Current usage metrics show cumulative count of Article Views (full-text article views including HTML views, PDF and ePub downloads, according to the available data) and Abstracts Views on Vision4Press platform.
Data correspond to usage on the plateform after 2015. The current usage metrics is available 48-96 hours after online publication and is updated daily on week days.
Initial download of the metrics may take a while.