Fig. 2
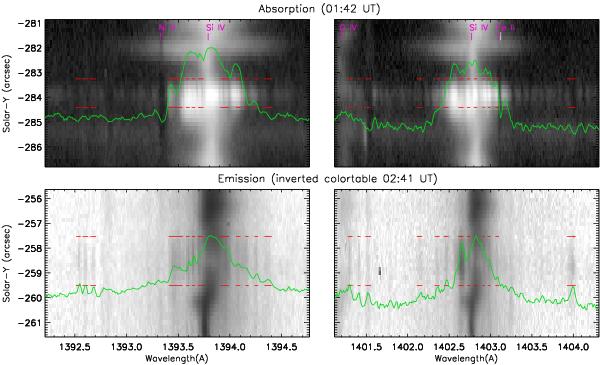
IRIS spectra surrounding the Si IV lines at 1393 Å and 1402 Å using a 30 s exposure. Upper panels show the absorption spectra taken at 12 October 2013 01:42 UT. The lower panel uses the fluorescent emission spectra with an inverted colortable (bright lines are black). The horizontal red lines show the location and width of molecular emission lines and are overlaid on the absorption spectra. The green profiles show the spectra (median filtered along the slit) of the region of the interest. The color table is logarithmic. An animated version of the absorption spectra is presented in the online edition of the journal. Each raster step moves 0.35′′ westward.
Current usage metrics show cumulative count of Article Views (full-text article views including HTML views, PDF and ePub downloads, according to the available data) and Abstracts Views on Vision4Press platform.
Data correspond to usage on the plateform after 2015. The current usage metrics is available 48-96 hours after online publication and is updated daily on week days.
Initial download of the metrics may take a while.