Fig. 5
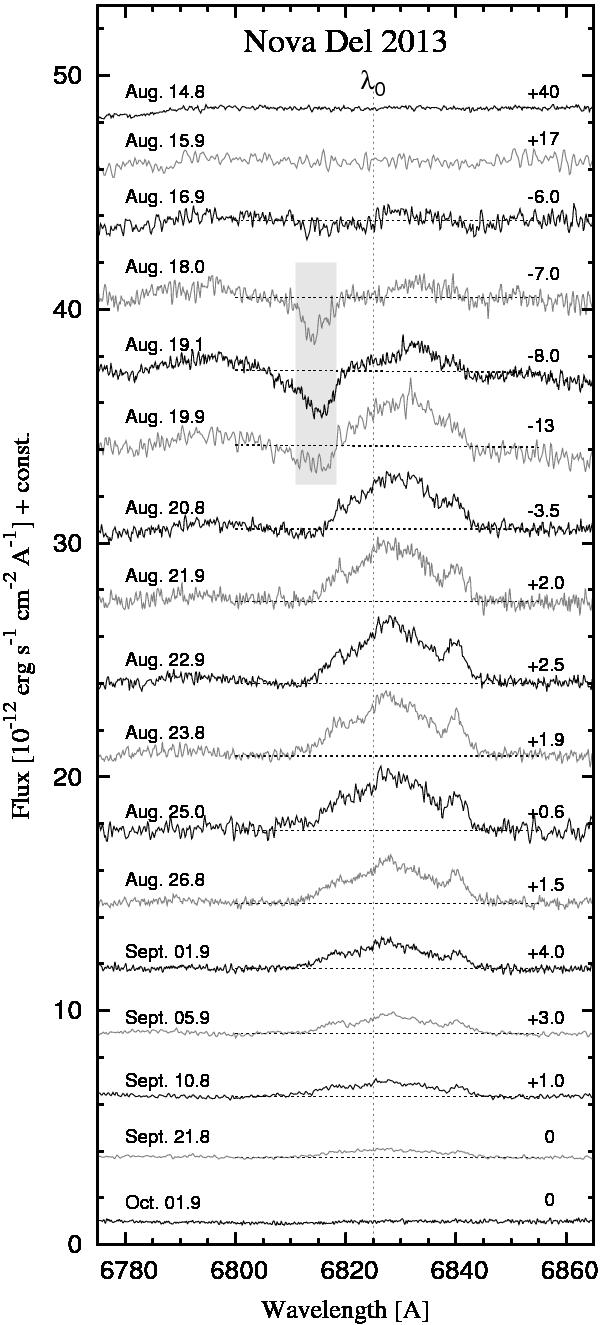
Evolution of the Raman-scattered O vi 1032 Å line becoming evident as an emission feature around 6830 Å since the onset of the outburst on Aug. 14 to its disappearance. The grey belt marks an absorption that developed at the end of the fireball stage. Numbers on the right side mark the shift of the local continuum (dotted lines) with respect to the units of the flux scale (arbitrarily added for a better visualization). Observing dates are marked at the left side.
Current usage metrics show cumulative count of Article Views (full-text article views including HTML views, PDF and ePub downloads, according to the available data) and Abstracts Views on Vision4Press platform.
Data correspond to usage on the plateform after 2015. The current usage metrics is available 48-96 hours after online publication and is updated daily on week days.
Initial download of the metrics may take a while.