Fig. 4
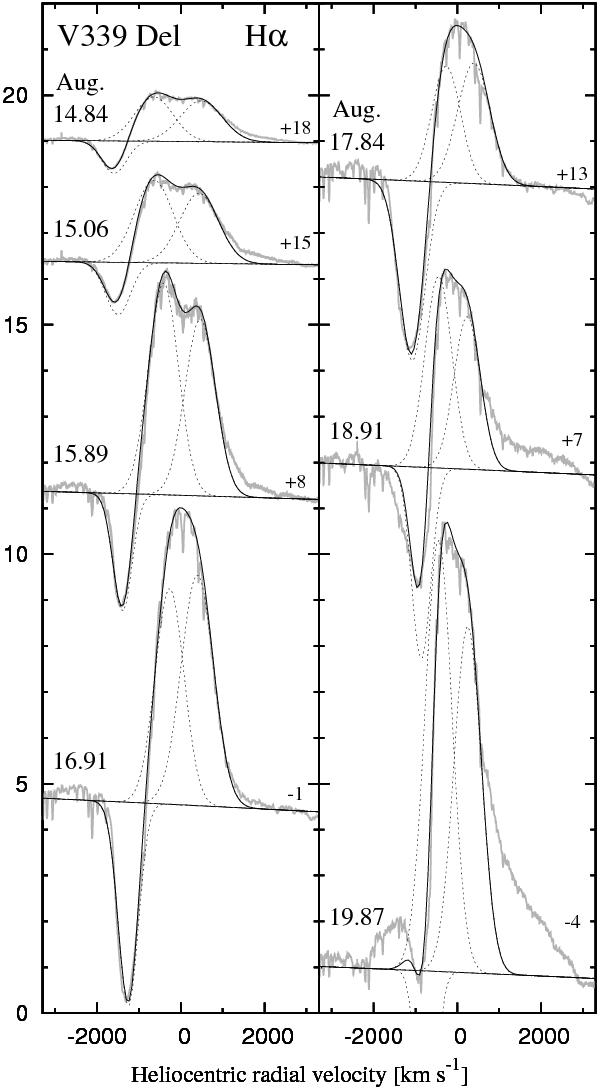
Evolution of the Hα line profile during the fireball phase of V339 Del (grey lines). Each profile was fitted with three Gaussian functions (dotted curves) to isolate its main components (Sect. 3.3). Numbers on the right side mark the shift of the profile in the given units for a better visualization. Dates are marked at the left side. Fluxes are in 10-11 erg cm-2 s-1 Å-1.
Current usage metrics show cumulative count of Article Views (full-text article views including HTML views, PDF and ePub downloads, according to the available data) and Abstracts Views on Vision4Press platform.
Data correspond to usage on the plateform after 2015. The current usage metrics is available 48-96 hours after online publication and is updated daily on week days.
Initial download of the metrics may take a while.