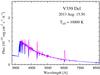
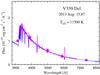
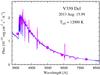
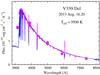
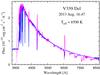
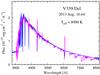
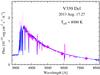
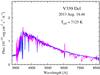
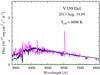
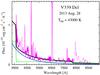
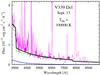
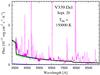
Fig. 1
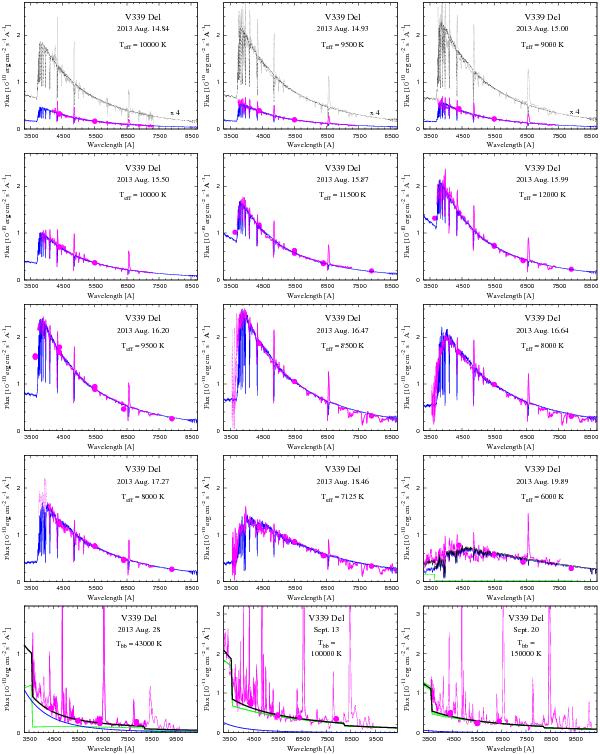
Comparison of the observed (in magenta: spectrum and photometric flux-points) and model SEDs of V339 Del. During the fireball stage (2013, Aug. 14.84 to 19.89), the model SED is represented by a synthetic spectrum (blue line, Eq. (1)), while during the following stage with a harder spectrum (bottom row of panels) the model SED (black line) is given by a superposition of the radiation from the WD pseudophotosphere (blue line) and the nebula (green line) according to Eq. (2).
Current usage metrics show cumulative count of Article Views (full-text article views including HTML views, PDF and ePub downloads, according to the available data) and Abstracts Views on Vision4Press platform.
Data correspond to usage on the plateform after 2015. The current usage metrics is available 48-96 hours after online publication and is updated daily on week days.
Initial download of the metrics may take a while.