Fig. 7
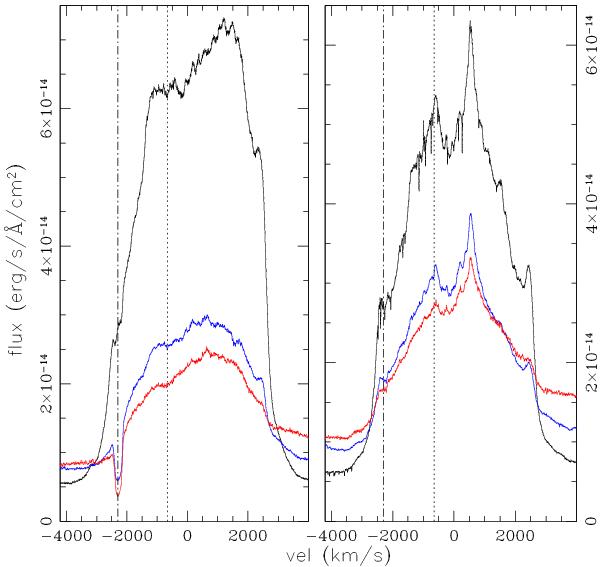
H-Balmer line profiles of nova LMC 2009b at day +8 (left panel) and +15 (right panel). The black color is for the Hα profile, blue is for the Hβ line and red for Hγ. The dotted vertical line mark the “depression” at –650 km s-1 discussed in the text, while the dotted-dashed line marks the “pseudo P-Cyg absorption” (at –2300 km s-1), also discussed in the text. See Sect. 4.2.
Current usage metrics show cumulative count of Article Views (full-text article views including HTML views, PDF and ePub downloads, according to the available data) and Abstracts Views on Vision4Press platform.
Data correspond to usage on the plateform after 2015. The current usage metrics is available 48-96 hours after online publication and is updated daily on week days.
Initial download of the metrics may take a while.