Free Access
Fig. 5
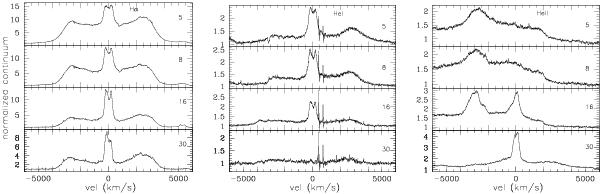
Profile evolution of YY Dor’s H, He i and He ii emission lines. Each line identification is marked on the top of each panel. The numbers on the right side of each subpanel indicate the age of the nova in day after maximum.
This figure is made of several images, please see below:
Current usage metrics show cumulative count of Article Views (full-text article views including HTML views, PDF and ePub downloads, according to the available data) and Abstracts Views on Vision4Press platform.
Data correspond to usage on the plateform after 2015. The current usage metrics is available 48-96 hours after online publication and is updated daily on week days.
Initial download of the metrics may take a while.