Fig. 3
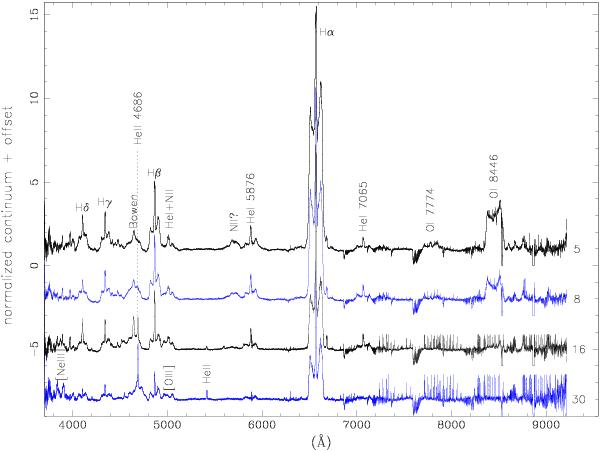
Sequence of our FEROS spectra showing the evolution of nova YY Dor 2004 outburst. Time increase from top to bottom and the numbers on the right side of each spectrum indicates the spectrum age in days after maximum/discovery. Spectra have been smoothed with a running boxcar of 33 and shifted vertically for clarity: spectrum 8 has been offset by –3, spectrum 16 by –6 and spectrum 30 by –9. Note that the spikes on the red side of each spectrum are due to poorly subtracted sky emission and/or telluric absorptions. This is particularly evident in relative long exposures and low SNR spectra.
Current usage metrics show cumulative count of Article Views (full-text article views including HTML views, PDF and ePub downloads, according to the available data) and Abstracts Views on Vision4Press platform.
Data correspond to usage on the plateform after 2015. The current usage metrics is available 48-96 hours after online publication and is updated daily on week days.
Initial download of the metrics may take a while.