Free Access
Fig. 1
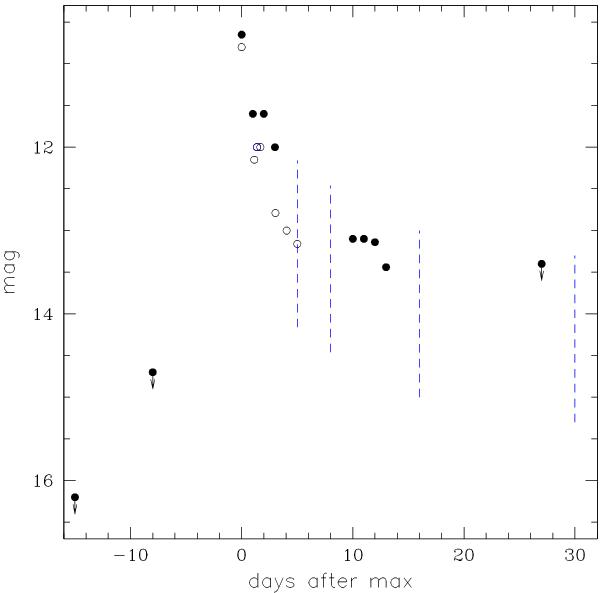
Light curves of YY Dor: black solid circles are for the B band 1937 light curve (McKibben 1941; downward arrows indicate upper limits); black circles are for the V band 2004 light curve (Liller 2004; Pearce 2004; Monard 2004; Bond et al. 2004). Blue dashed vertical lines indicate the epochs of our FEROS observations.
Current usage metrics show cumulative count of Article Views (full-text article views including HTML views, PDF and ePub downloads, according to the available data) and Abstracts Views on Vision4Press platform.
Data correspond to usage on the plateform after 2015. The current usage metrics is available 48-96 hours after online publication and is updated daily on week days.
Initial download of the metrics may take a while.