Free Access
Fig. 3
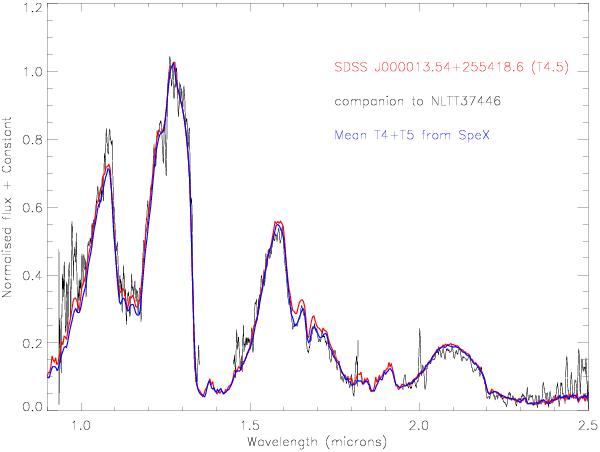
NTT/SofI low-resolution near-infrared spectra of the T4.5 dwarf co-moving with HIP 70849 (black line). Overplotted are IRTF/SpeX spectra of SDSS J000013.54+255418.6 (T4.5; Knapp et al. 2004; Jameson et al. 2008; Burgasser et al. 2006) and the average spectrum of a T4 and T5 dwarf.
Current usage metrics show cumulative count of Article Views (full-text article views including HTML views, PDF and ePub downloads, according to the available data) and Abstracts Views on Vision4Press platform.
Data correspond to usage on the plateform after 2015. The current usage metrics is available 48-96 hours after online publication and is updated daily on week days.
Initial download of the metrics may take a while.