Fig. 7
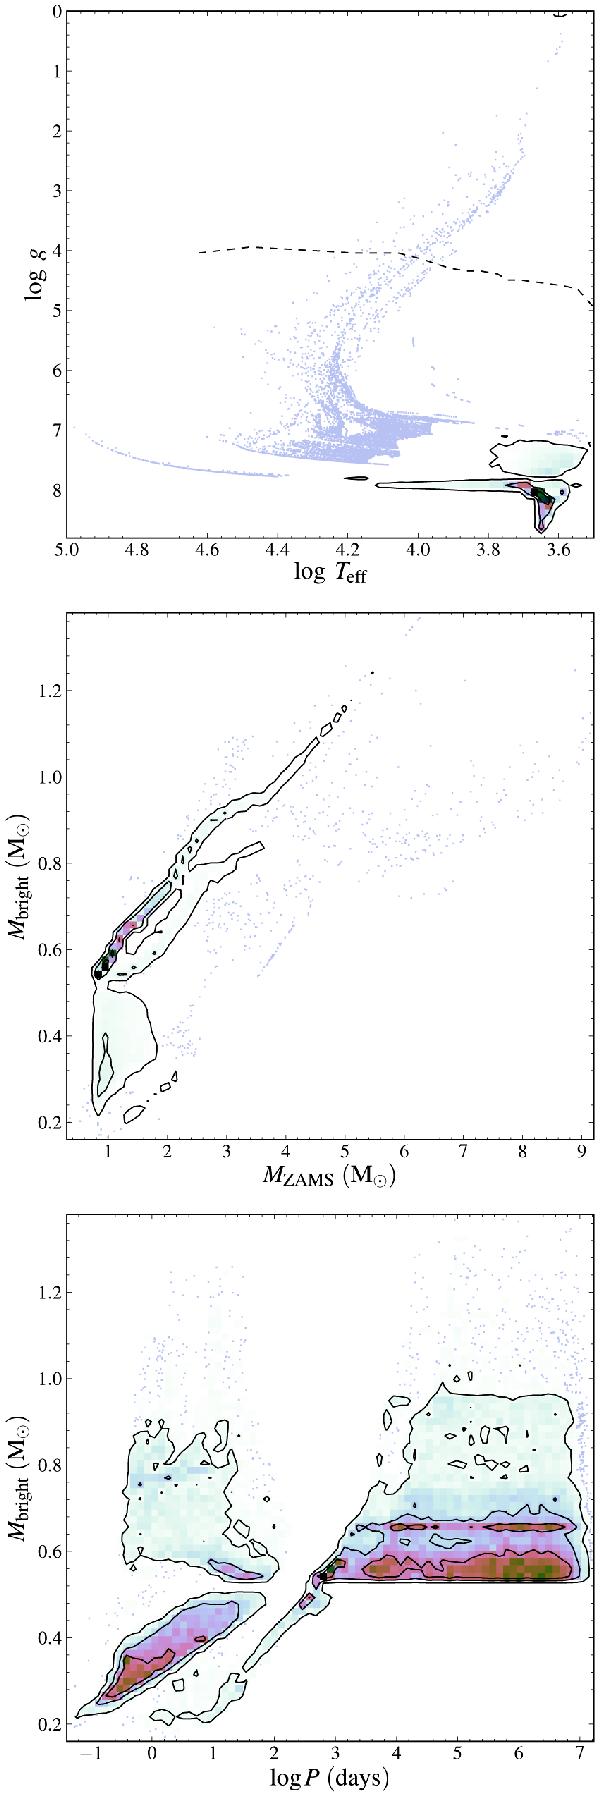
Properties of all 1.3 × 10⁶ unresolved binary WD pairs in our simulation box (maximum magnitude G = 35), for our standard model. Contour lines mark the regions in which 33%, 67% and 95% of the binaries are located. Higher density regions are given darker colours. The 1% binaries in the tail of the distribution are indicated by the scattered points. Compared to Fig. 6, this figure hardly has statistical noise because of the large number of halo WDs we expect to find in the Milky Way halo if we would go up to magnitude G = 35.
Current usage metrics show cumulative count of Article Views (full-text article views including HTML views, PDF and ePub downloads, according to the available data) and Abstracts Views on Vision4Press platform.
Data correspond to usage on the plateform after 2015. The current usage metrics is available 48-96 hours after online publication and is updated daily on week days.
Initial download of the metrics may take a while.