Fig. 4
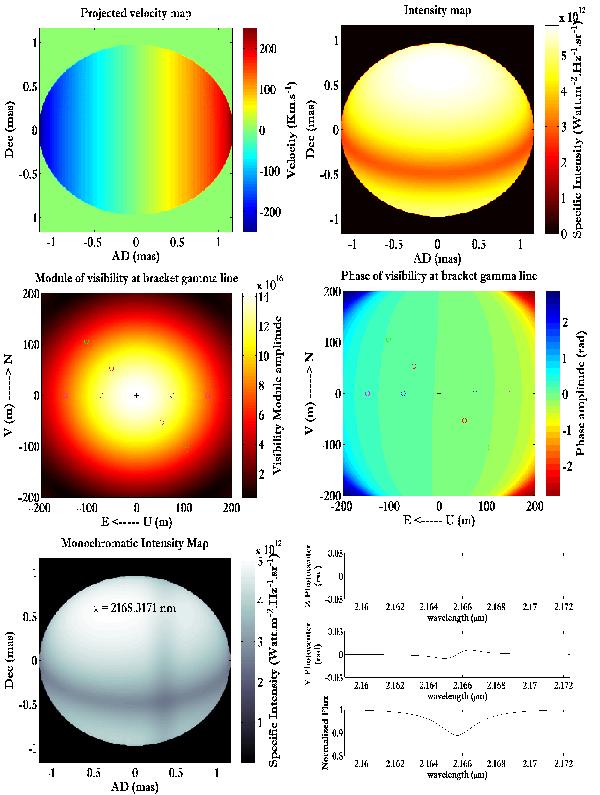
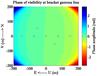
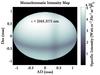
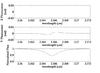
Top-left: velocity map of the same model (inclination 60°, orientation 0°). Then for the simulated rotation a rigid body is assumed, and a velocity around 90% of the critical velocity of the star. Top-right: simulated intensity map in the continuum assuming von Zeipel gravity and limb-darkening effects where the poles are brighter than at the equator. Center-left: corresponding 2D map of the visibility modulus, where the four interferometric baselines cited above are represented by circles: ([ 75 m,45° ] in red circle, [ 150 m,45° ] in green circle, [ 75 m,90° ] in blue circle and [ 150 m,90° ] in magenta circle). Center-right: same as for the 2D map of the visibility phase. ([ 75 m,45° ] in red circle, [ 150 m,45° ] in green circle, [ 75 m,90° ] in blue circle and [ 150 m,90° ] in magenta circle). Bottom-left: monochromatic intensity map for a given Doppler shift across the Brackett spectral line. Bottom-right: top: photo-center along the Z axis. (Z axis represents the declination and Y axis the right ascension.) Middle: photo-center along Y (the photo-centers are in radians). Bottom: normalized spectrum with the Brackett γ rotationally broadened line.
Current usage metrics show cumulative count of Article Views (full-text article views including HTML views, PDF and ePub downloads, according to the available data) and Abstracts Views on Vision4Press platform.
Data correspond to usage on the plateform after 2015. The current usage metrics is available 48-96 hours after online publication and is updated daily on week days.
Initial download of the metrics may take a while.