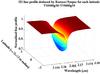
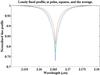
Fig. 3
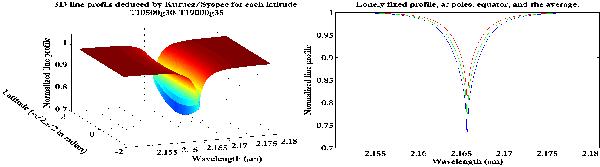
Left: 3D Brackett γ local line profile representation for a
star with  at the poles and
 at the equator from
Kurucz/Synspec model. The polar line profiles (in the board) have less amplitude
than the equatorial one in the middle. Right: 3 panels of 1D cuts
of the same 3D figure at different latitudes; at the poles (red line), at the
equator (blue) and the average (in green).
at the equator from
Kurucz/Synspec model. The polar line profiles (in the board) have less amplitude
than the equatorial one in the middle. Right: 3 panels of 1D cuts
of the same 3D figure at different latitudes; at the poles (red line), at the
equator (blue) and the average (in green).
Current usage metrics show cumulative count of Article Views (full-text article views including HTML views, PDF and ePub downloads, according to the available data) and Abstracts Views on Vision4Press platform.
Data correspond to usage on the plateform after 2015. The current usage metrics is available 48-96 hours after online publication and is updated daily on week days.
Initial download of the metrics may take a while.