Fig. 5
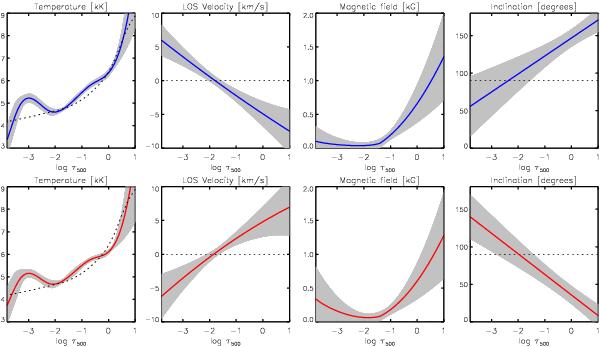
Mean atmospheric stratifications obtained from the inversion of the selected pixels in the Hinode/SP normal map (Fig. 3). The first and second rows represent the results for blue and red events, respectively. Color coding follows this designation. The first column displays the temperature T, second column the LOS velocity vLOS with positive values representing downflows, third column the magnetic field intensity B, and fourth column the inclination of the magnetic field γ. Gray areas indicate the deviation from the mean stratifications obtained from the 358 pixels belonging to blue events and 158 pixels belonging to red events (see Sect. 3.1).
Current usage metrics show cumulative count of Article Views (full-text article views including HTML views, PDF and ePub downloads, according to the available data) and Abstracts Views on Vision4Press platform.
Data correspond to usage on the plateform after 2015. The current usage metrics is available 48-96 hours after online publication and is updated daily on week days.
Initial download of the metrics may take a while.