Fig. 4
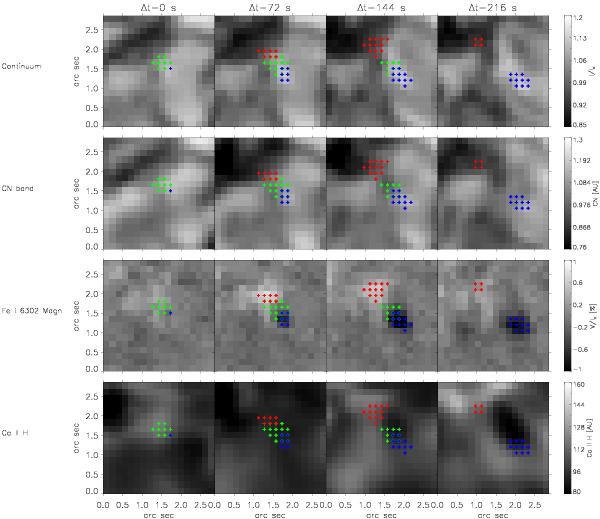
Evolution of a single event detected with the Hinode/SP time series. Each column corresponds to a different time in its evolution. The first row displays the continuum signal from Hinode/SP, the second row shows the CN broadband image from Hinode/BFI, the third row displays the Fe i 6302.5 Å magnetogram from Hinode/SP, and the fourth row shows the Ca ii h broadband images from Hinode/BFI. We have also highlighted the pixels with blue- and red-shifted single-lobed Stokes V profiles with blue and red crosses, respectively. Pixels with linear polarization signals above 0.01 Ic are indicated with green crosses.
Current usage metrics show cumulative count of Article Views (full-text article views including HTML views, PDF and ePub downloads, according to the available data) and Abstracts Views on Vision4Press platform.
Data correspond to usage on the plateform after 2015. The current usage metrics is available 48-96 hours after online publication and is updated daily on week days.
Initial download of the metrics may take a while.